1. Introduction to Testing in Rust
Testing is a crucial aspect of software development, and Rust provides a robust framework for writing and executing tests. The Rust programming language emphasizes safety and performance, making testing an integral part of the development process. Rust's built-in testing capabilities allow developers to ensure that their code behaves as expected, which is essential for maintaining code quality and reliability.
- Rust includes a built-in test framework that simplifies the process of writing and running tests.
- The framework supports unit tests, integration tests, and documentation tests, catering to various testing needs, including rust unit test and rust integration test.
- Tests can be run using the Cargo package manager, which is the standard tool for managing Rust projects.
1.1. Importance of Testing in Rust Development
Testing in Rust is vital for several reasons:
- Ensures Code Quality: Testing helps identify bugs and issues early in the development process, reducing the likelihood of defects in production code. This is particularly important in areas like rust performance testing.
- Facilitates Refactoring: With a comprehensive suite of tests, developers can confidently refactor code, knowing that any unintended changes will be caught by the tests. This is a key aspect of rust test driven development.
- Enhances Collaboration: In team environments, tests serve as documentation for how the code is expected to behave, making it easier for new team members to understand the codebase. This is especially useful in contexts like testing in rust.
- Promotes Reliability: Regular testing increases the reliability of the software, which is particularly important in systems where safety and performance are critical, such as in rust load testing.
Writing Tests in Rust
To write tests in Rust, you typically follow these steps:
- Create a new Rust project using Cargo:
language="language-bash"cargo new my_project-a1b2c3-cd my_project
- Write your code in the
src/lib.rsfile orsrc/main.rsfile. - Add tests in a separate module within the same file or in a dedicated
testsdirectory.
Example of a simple test:
language="language-rust"// src/lib.rs-a1b2c3-pub fn add(a: i32, b: i32) -> i32 {-a1b2c3- a + b-a1b2c3-}-a1b2c3--a1b2c3-#[cfg(test)]-a1b2c3-mod tests {-a1b2c3- use super::*;-a1b2c3--a1b2c3- #[test]-a1b2c3- fn test_add() {-a1b2c3- assert_eq!(add(2, 3), 5);-a1b2c3- }-a1b2c3-}
Running Tests
To run your tests, use the following command:
language="language-bash"cargo test
This command will compile your code and execute all tests defined in your project. The output will indicate which tests passed and which failed.
Types of Tests in Rust
Rust supports several types of tests:
- Unit Tests: These tests focus on small, isolated pieces of code, typically functions or methods. They are defined in the same file as the code they test.
- Integration Tests: These tests check how different parts of the code work together. They are placed in the
testsdirectory and can access the public API of your library, which is essential for actix web test scenarios. - Documentation Tests: Rust allows you to write tests within your documentation comments. These tests ensure that the examples in your documentation are correct, which is crucial for test driven development rust.
Debugging Rust Code
Debugging is an essential part of the development process. Rust provides several tools and techniques for debugging:
- Using
println!Macro: A simple way to debug is to insertprintln!statements in your code to output variable values and program flow. - Debugging with
gdborlldb: You can use these debuggers to step through your code, inspect variables, and analyze the call stack. - Using IDEs: Many Integrated Development Environments (IDEs) like Visual Studio Code and IntelliJ Rust offer built-in debugging tools that can simplify the debugging process.
By leveraging Rust's testing and debugging capabilities, developers can create reliable and maintainable software that meets high standards of quality. At Rapid Innovation, we understand the importance of these practices and are committed to helping our clients implement effective testing strategies that enhance their software development processes. Partnering with us means you can expect greater ROI through improved code quality, reduced time to market, and increased reliability of your applications. Let us guide you in achieving your development goals efficiently and effectively, including strategies for rust test, rust performance testing, and more.
1.2. Types of Tests in Rust
At Rapid Innovation, we understand that ensuring the reliability and correctness of your code is paramount to achieving your business goals. Rust provides a robust rust testing framework that allows developers to do just that. The two primary types of tests in Rust are unit tests and integration tests, each serving a distinct purpose in the development process.
1.2.1. Unit Tests
Unit tests are designed to test individual components or functions in isolation. They help verify that each part of the code behaves as expected. In Rust, unit tests are typically written in the same file as the code they are testing, within a special module annotated with #[cfg(test)]. This keeps the tests close to the code, making it easier to maintain and understand.
Key features of unit tests in Rust include:
- Isolation: Each test runs independently, ensuring that the outcome of one test does not affect another.
- Speed: Unit tests are generally fast to execute, allowing for quick feedback during development.
- Assertions: Rust provides a variety of assertion macros, such as
assert_eq!,assert_ne!, andassert!, to validate expected outcomes.
To create a unit test in Rust, follow these steps:
- Define a module for tests using
#[cfg(test)]. - Write test functions using the
#[test]attribute. - Use assertion macros to check expected results.
Example code for a unit test:
language="language-rust"#[cfg(test)]-a1b2c3-mod tests {-a1b2c3- use super::*;-a1b2c3--a1b2c3- #[test]-a1b2c3- fn test_addition() {-a1b2c3- let result = add(2, 3);-a1b2c3- assert_eq!(result, 5);-a1b2c3- }-a1b2c3-}
In this example, the add function is tested to ensure it returns the correct sum. The test will pass if the result is 5; otherwise, it will fail.
1.2.2. Integration Tests
Integration tests are used to test the interaction between multiple components or modules. Unlike unit tests, which focus on individual functions, integration tests assess how different parts of the application work together. These tests are typically placed in a separate directory called tests, which is at the same level as the src directory.
Key features of integration tests in Rust include:
- Module-level testing: Integration tests can access the public API of the entire crate, allowing for comprehensive testing of how components interact.
- Real-world scenarios: They can simulate real-world usage of the application, providing insights into how the system behaves under various conditions.
- Separation from unit tests: Keeping integration tests separate from unit tests helps maintain clarity and organization in the codebase.
To create an integration test in Rust, follow these steps:
- Create a
testsdirectory in the root of your project. - Add a new Rust file for your test.
- Write test functions using the
#[test]attribute.
Example code for an integration test:
language="language-rust"// tests/integration_test.rs-a1b2c3-use my_crate::add;-a1b2c3--a1b2c3-#[test]-a1b2c3-fn test_addition_integration() {-a1b2c3- let result = add(5, 7);-a1b2c3- assert_eq!(result, 12);-a1b2c3-}
In this example, the add function is tested in the context of the entire crate, ensuring that it behaves correctly when called from outside its module.
Both unit tests and integration tests are essential for maintaining high-quality Rust code. They help catch bugs early, improve code reliability, and facilitate easier refactoring. By leveraging Rust's built-in rust testing framework, developers can create a comprehensive suite of tests that cover both individual components and their interactions.
At Rapid Innovation, we are committed to helping our clients achieve greater ROI through efficient and effective development practices. By implementing rigorous testing strategies like those outlined above, we ensure that your software is not only functional but also reliable and scalable. Partnering with us means you can expect enhanced code quality, reduced time to market, and ultimately, a more successful product. Let us help you navigate the complexities of AI and Blockchain development with confidence.
1.2.3. Documentation Tests
At Rapid Innovation, we understand that documentation tests are an essential part of ensuring that the examples provided in your documentation are accurate and functional. They serve as a bridge between documentation and testing, allowing developers to verify that the code snippets work as intended.
- Purpose of Documentation Tests:
- Validate code examples in documentation.
- Ensure that users can follow examples without errors.
- Improve the reliability of the documentation.
- How to Write Documentation Tests:
- Use comments in your code to provide examples.
- Include test cases that can be executed directly from the documentation.
Example in Rust:
language="language-rust"/// Adds two numbers together.-a1b2c3-///-a1b2c3-/// # Examples-a1b2c3-///-a1b2c3-///
/// let result = add(2, 3); /// assert_eq!(result, 5); ///
language="language-plaintext"fn add(a: i32, b: i32) -> i32 {-a1b2c3- a + b-a1b2c3-}
- Running Documentation Tests:
- Use the command
cargo testin Rust to run all tests, including documentation tests. - This command will automatically find and execute the examples in the documentation.
- Use the command
2. Writing Unit Tests
Unit tests are designed to test individual components of your code in isolation. They help ensure that each part of your application behaves as expected.
- Benefits of Unit Testing:
- Catches bugs early in the development process.
- Facilitates code refactoring by ensuring existing functionality remains intact.
- Provides documentation for how functions are expected to behave.
- Steps to Write Unit Tests:
- Identify the function or module to be tested.
- Create a new test module using the
#[cfg(test)]attribute. - Write test functions that assert expected outcomes.
Example in Rust:
language="language-rust"#[cfg(test)]-a1b2c3-mod tests {-a1b2c3- use super::*;-a1b2c3--a1b2c3- #[test]-a1b2c3- fn test_add() {-a1b2c3- assert_eq!(add(2, 3), 5);-a1b2c3- assert_eq!(add(-1, 1), 0);-a1b2c3- }-a1b2c3-}
- Running Unit Tests:
- Use the command
cargo testto execute all unit tests in your project. - Review the output to ensure all tests pass.
- Use the command
2.1. Test Module and #[cfg(test)] Attribute
The #[cfg(test)] attribute is crucial for organizing your test code in Rust. It allows you to define a separate module for tests that will only be compiled when running tests.
- Purpose of the Test Module:
- Keeps test code separate from production code.
- Prevents test code from being included in the final binary, reducing size and improving performance.
- How to Use the
#[cfg(test)]Attribute:- Place the attribute above a module declaration.
- Define your test functions within this module.
Example:
language="language-rust"#[cfg(test)]-a1b2c3-mod tests {-a1b2c3- use super::*;-a1b2c3--a1b2c3- #[test]-a1b2c3- fn test_subtract() {-a1b2c3- assert_eq!(subtract(5, 3), 2);-a1b2c3- }-a1b2c3-}
- Key Points:
- The
#[cfg(test)]attribute ensures that the test module is only compiled during testing. - This helps maintain a clean separation between test and production code, enhancing maintainability.
- The
By following these guidelines for documentation tests, unit tests, and utilizing the #[cfg(test)] attribute, you can create a robust testing framework that enhances the reliability and usability of your code. At Rapid Innovation, we are committed to helping you implement these best practices, ensuring that your development process is efficient and effective, ultimately leading to greater ROI for your projects. Partnering with us means you can expect improved code quality, reduced time to market, and a more streamlined development experience.
Additionally, incorporating a test plan, such as a software test plan example, can help structure your testing efforts. Creating test cases, including a test case example in software testing, ensures comprehensive coverage. Utilizing tools like azure devops test plans can streamline your process, while maintaining a requirement traceability matrix example can enhance your documentation testing. Writing test cases and following a test strategy in software testing will further solidify your approach, ensuring that all aspects of your software are thoroughly validated.
2.2. Writing Basic Test Functions
Writing basic test functions is essential for ensuring that your code behaves as expected. These functions help in validating the functionality of your code by checking if the output matches the expected results. Here are some key points to consider when writing test functions:
- Define the Purpose: Clearly state what the function is supposed to test. This helps in maintaining focus and clarity.
- Use Descriptive Names: Name your test functions descriptively to indicate what they are testing. For example,
testAdditionFunctionis more informative thantest1. - Setup and Teardown: If your tests require specific conditions or data, set them up at the beginning of the test function and clean up afterward. This ensures that tests do not interfere with each other.
- Return Values: Test functions should return a boolean value indicating whether the test passed or failed. This can be done using simple return statements.
- Example of a Basic Test Function:
language="language-python"def test_addition():-a1b2c3- result = add(2, 3)-a1b2c3- expected = 5-a1b2c3- return result == expected
- Run Tests: Create a main function to run all your test functions and report the results.
language="language-python"def run_tests():-a1b2c3- assert test_addition(), "Test Addition Failed"-a1b2c3- print("All tests passed!")
2.3. Using Assert Macros
Assert macros are a powerful way to validate conditions in your tests. They provide a simple syntax for checking if a condition is true, and if not, they throw an error. This makes it easier to identify failing tests.
- Basic Usage: The assert macro checks a condition and raises an error if the condition is false.
- Example of Using Assert:
language="language-python"def test_subtraction():-a1b2c3- result = subtract(5, 3)-a1b2c3- assert result == 2, "Subtraction Test Failed"
- Benefits of Assert Macros:
- Readability: They make the code easier to read and understand.
- Immediate Feedback: You get immediate feedback on what went wrong if a test fails.
- Simplified Debugging: Assert messages can provide context for failures, making debugging easier.
- Common Assert Macros:
assertEqual(a, b): Checks ifais equal tob.assertTrue(condition): Checks if the condition is true.assertFalse(condition): Checks if the condition is false.
2.3.1. assert!
The assert! macro is a specific implementation that can be used in some programming languages to provide a more concise way to assert conditions. It is particularly useful in languages that support macros or have a built-in assert function.
- Usage: The
assert!macro can be used to check conditions in a more streamlined manner. - Example of assert!:
language="language-rust"fn test_multiplication() {-a1b2c3- let result = multiply(3, 4);-a1b2c3- assert!(result == 12, "Multiplication Test Failed");-a1b2c3-}
- Advantages of assert!:
- Conciseness: Reduces boilerplate code, making tests shorter and easier to write.
- Custom Messages: Allows for custom error messages to be displayed when a test fails.
- Considerations:
- Ensure that the assert macro is available in your programming environment.
- Use assert macros judiciously to avoid overly complex test conditions.
By following these guidelines for writing basic test functions, such as the integral convergence test or the second derivative test, and using assert macros, you can create a robust testing framework that helps ensure the reliability of your code. Additionally, consider implementing tests for cognitive function tests, MBTI functions test, and Jungian cognitive functions test to cover a broader range of functionalities.
2.3.2. assert_eq!
The assert_eq! macro in Rust is a powerful tool for testing that two values are equal. It is commonly used in unit tests to verify that the output of a function matches the expected result. If the values are not equal, the test will fail, providing a clear message about the mismatch.
- Syntax:
language="language-rust"assert_eq!(left_value, right_value);
- Key Features:
- Comparison: It checks for equality using the
PartialEqtrait. - Debugging: If the assertion fails, it prints both values, making it easier to identify the issue.
- Type Safety: Rust's strong type system ensures that the types of the values being compared are compatible.
- Example Usage:
language="language-rust"#[cfg(test)]-a1b2c3-mod tests {-a1b2c3- #[test]-a1b2c3- fn test_addition() {-a1b2c3- let sum = 2 + 2;-a1b2c3- assert_eq!(sum, 4); // This will pass-a1b2c3- }-a1b2c3-}
- Common Use Cases:
- Validating function outputs.
- Ensuring that data structures contain expected values.
- Testing API responses.
2.3.3. assert_ne!
The assert_ne! macro serves the opposite purpose of assert_eq!. It checks that two values are not equal. This is particularly useful when you want to ensure that a function does not produce a specific output or that two variables differ.
- Syntax:
language="language-rust"assert_ne!(left_value, right_value);
- Key Features:
- Inequality Check: It uses the
PartialEqtrait to determine if the values are not equal. - Error Reporting: If the assertion fails, it provides both values, aiding in debugging.
- Type Safety: Similar to
assert_eq!, it ensures that the types of the values being compared are compatible. - Example Usage:
language="language-rust"#[cfg(test)]-a1b2c3-mod tests {-a1b2c3- #[test]-a1b2c3- fn test_subtraction() {-a1b2c3- let difference = 5 - 3;-a1b2c3- assert_ne!(difference, 0); // This will pass-a1b2c3- }-a1b2c3-}
- Common Use Cases:
- Ensuring that a function does not return a specific value.
- Validating that two variables are different after a computation.
- Testing conditions where a result should not match an expected failure case.
2.4. Testing Private Functions
Testing private functions in Rust can be a bit tricky since they are not accessible from outside their module. However, there are strategies to effectively test these functions without exposing them unnecessarily.
- Use a Public Test Module:
- You can create a public module within the same file that contains your tests. This allows you to access private functions while keeping them encapsulated.
- Example:
language="language-rust"mod my_module {-a1b2c3- fn private_function() -> i32 {-a1b2c3- 42-a1b2c3- }-a1b2c3--a1b2c3- #[cfg(test)]-a1b2c3- mod tests {-a1b2c3- use super::*;-a1b2c3--a1b2c3- #[test]-a1b2c3- fn test_private_function() {-a1b2c3- assert_eq!(private_function(), 42);-a1b2c3- }-a1b2c3- }-a1b2c3-}
- Benefits:
- Encapsulation: Keeps the private function hidden from other modules.
- Direct Testing: Allows for direct testing of the function's logic without needing to expose it.
- Considerations:
- Ensure that testing private functions does not lead to tightly coupled code.
- Focus on testing the public interface of your module, as this is generally a better practice.
By utilizing asserteq! and assertne!, along with strategic testing of private functions, you can create robust tests that ensure your Rust code behaves as expected.
2.5. Organizing Multiple Tests
Organizing multiple tests is crucial for maintaining a clean and efficient testing environment. It helps in managing test cases, ensuring that they are easy to run, and facilitating collaboration among team members. Here are some strategies for organizing tests effectively:
- Directory Structure:
- Create a clear directory structure for your tests. For example:
language="language-plaintext"/tests-a1b2c3-/unit-a1b2c3-/integration-a1b2c3-/e2e
- This structure allows for easy navigation and helps in identifying the type of tests quickly.
- Naming Conventions:
- Use consistent naming conventions for test files and functions. For instance, prefix unit tests with
test_and integration tests withintegration_. - This practice makes it easier to identify the purpose of each test at a glance.
- Grouping Related Tests:
- Group related tests into suites. For example, if you have multiple tests for a specific feature, consider creating a test suite that encompasses all related tests.
- This can be achieved using testing frameworks like Jest or Mocha, which allow you to define test suites.
- Documentation:
- Document your tests and their purpose. This can be done in a README file or within the test files themselves using comments.
- Clear documentation helps new team members understand the testing strategy and the purpose of each test.
- Continuous Integration:
- Integrate your tests with a CI/CD pipeline. This ensures that tests are run automatically on code changes, helping to catch issues early.
- Tools like Jenkins, Travis CI, or GitHub Actions can be used for this purpose. Additionally, consider using continuous integration testing tools like Selenium integrated development environment or CI testing tools to enhance your testing process.
3. Integration Testing
Integration testing is a critical phase in the software development lifecycle where individual components are tested together to ensure they work as expected. This type of testing helps identify issues that may not be apparent when components are tested in isolation.
- Purpose of Integration Testing:
- Verify the interaction between different modules or services.
- Ensure that data flows correctly between components.
- Identify interface defects and integration issues.
- Types of Integration Testing:
- Big Bang Integration Testing: All components are integrated simultaneously and tested as a whole.
- Incremental Integration Testing: Components are integrated and tested one at a time, either top-down or bottom-up.
- Tools for Integration Testing:
- Use tools like Postman for API testing, Selenium for web applications, or JUnit for Java applications. You can also utilize tools like Jira Xray or Zephyr for Jira for test management and reporting.
- These tools help automate the testing process and provide detailed reports on test results.
- Best Practices:
- Write clear and concise test cases that outline the expected behavior of integrated components.
- Use mock services or stubs to simulate external dependencies during testing.
- Regularly review and update integration tests to reflect changes in the application.
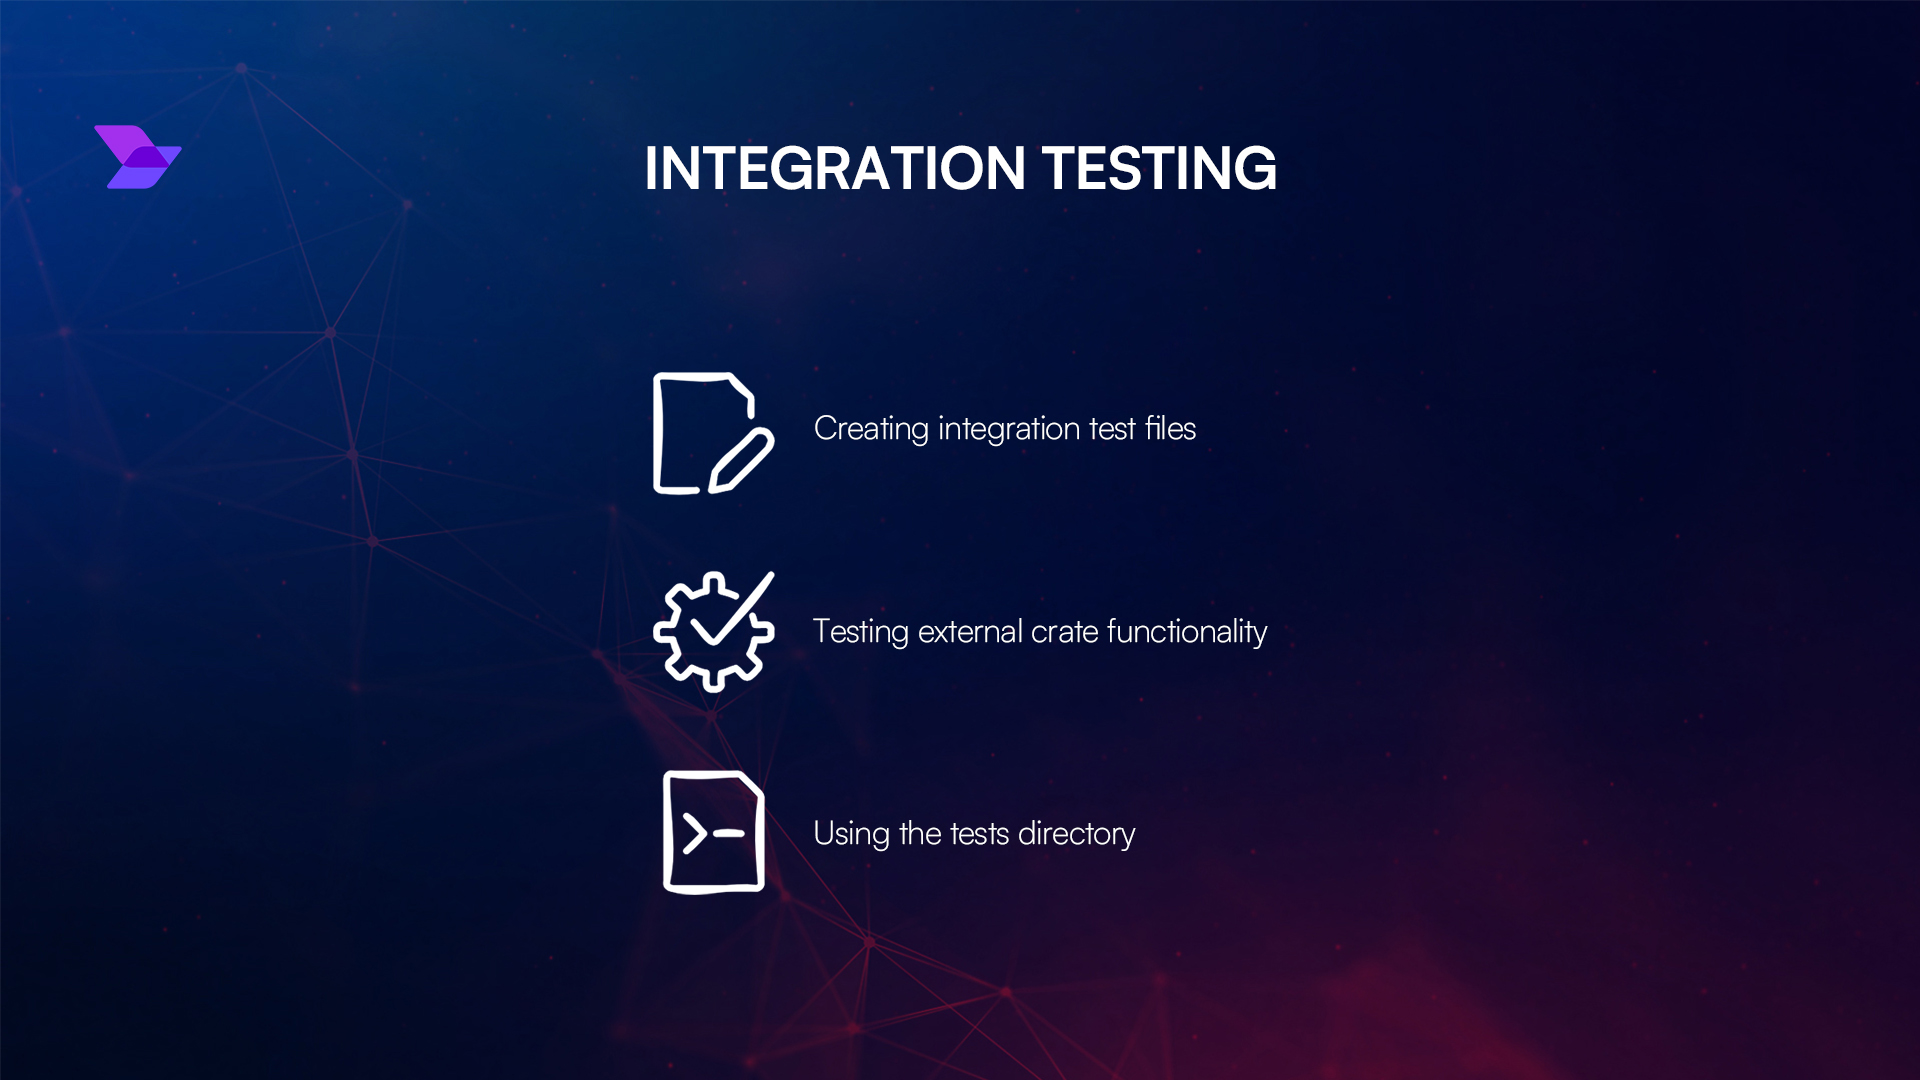
3.1. Creating Integration Test Files
Creating integration test files is essential for ensuring that your integration tests are organized and maintainable. Here are steps to create effective integration test files:
- Choose a Testing Framework:
- Select a testing framework that suits your project needs, such as Jest, Mocha, or NUnit.
- Set Up the Test Environment:
- Configure your testing environment to include necessary dependencies and tools.
- Ensure that your database or any external services are accessible during testing.
- Create Test Files:
- Create a dedicated directory for integration tests, e.g.,
/tests/integration. - Name your test files descriptively, indicating the functionality being tested, e.g.,
userIntegration.test.js. - Write Test Cases:
- Define test cases that cover various scenarios, including both positive and negative cases.
- Use assertions to verify that the expected outcomes match the actual results.
- Run Tests:
- Execute your integration tests using the chosen framework's command line interface.
- Monitor the output for any failures and address issues as they arise.
- Maintain and Refactor:
- Regularly review and refactor your integration tests to improve readability and maintainability.
- Remove obsolete tests and update existing ones to reflect changes in the application.
By following these steps, you can create a robust set of integration test files that contribute to the overall quality of your software, ensuring that tools like Jira test case management and test management tools for Jira are effectively utilized.
3.2. Testing External Crate Functionality
At Rapid Innovation, we understand that testing external crates is essential for ensuring that your application interacts correctly with third-party libraries. This process is crucial for identifying issues that may arise from dependencies, ensuring that they function as expected within your project. By partnering with us, you can leverage our expertise to streamline this process and achieve greater ROI.
- Understand the external crate's API:
- Review the documentation of the crate to understand its functions and expected behavior.
- Identify the specific features you need to test.
- Set up your testing environment:
- Include the external crate in your
Cargo.tomlfile. - Use the
cargo testcommand to run your tests.
- Include the external crate in your
- Write tests for the external crate:
- Create a new test module in your Rust file.
- Use the
#[cfg(test)]attribute to define your test module. - Write test functions that call the external crate's functions and assert their outputs.
Example code snippet:
language="language-rust"#[cfg(test)]-a1b2c3-mod tests {-a1b2c3- use super::*;-a1b2c3- use external_crate::some_function;-a1b2c3--a1b2c3- #[test]-a1b2c3- fn test_some_function() {-a1b2c3- let result = some_function(5);-a1b2c3- assert_eq!(result, expected_value);-a1b2c3- }-a1b2c3-}
- Run your tests:
- Execute
cargo testto run all tests, including those for external crates. - Review the output for any failures or errors.
- Execute
3.3. Using the tests Directory
Organizing your tests in a dedicated tests directory can enhance the structure and maintainability of your Rust project. This directory is specifically designed for integration tests, which test the functionality of your entire application. Rapid Innovation can assist you in implementing best practices for test organization, ensuring your project remains scalable and efficient.
- Create a
testsdirectory:- In the root of your project, create a folder named
tests.
- In the root of your project, create a folder named
- Add test files:
- Create separate Rust files for different test cases or modules.
- Each file should contain tests that are relevant to the functionality being tested.
- Write integration tests:
- Use the
extern cratedeclaration to include your main crate. - Write tests that interact with your public API.
- Use the
Example code snippet:
language="language-rust"// tests/integration_test.rs-a1b2c3-extern crate my_crate;-a1b2c3--a1b2c3-#[test]-a1b2c3-fn test_integration() {-a1b2c3- let result = my_crate::public_function();-a1b2c3- assert!(result.is_ok());-a1b2c3-}
- Run integration tests:
- Use the command
cargo testto run all tests, including those in thetestsdirectory. - Check the output for any issues.
- Use the command
4. Documentation Tests
Documentation tests are a unique feature in Rust that allows you to ensure that the examples in your documentation are correct and functional. This is particularly useful for maintaining accurate and reliable documentation, which is a key aspect of delivering high-quality software solutions.
- Write documentation comments:
- Use triple slashes (
///) to write documentation comments above your functions or modules. - Include examples that demonstrate how to use the function.
- Use triple slashes (
- Add testable examples:
- Ensure that your examples are valid Rust code that can be executed.
- Use the
///comments to provide context for the examples.
Example code snippet:
language="language-rust"/// Adds two numbers together.-a1b2c3-/// -a1b2c3-/// # Examples-a1b2c3-/// -a1b2c3-///
/// let result = mycrate::add(2, 3); /// asserteq!(result, 5); ///
language="language-plaintext"pub fn add(a: i32, b: i32) -> i32 {-a1b2c3- a + b-a1b2c3-}
- Run documentation tests:
- Use the command
cargo test --docto run tests on your documentation examples. - Review the output to ensure all examples pass.
- Use the command
By following these steps, you can effectively test external crate functionality, utilize the tests directory for better organization, and ensure your documentation remains accurate and helpful. At Rapid Innovation, we are committed to helping you achieve your goals efficiently and effectively, ensuring that your projects are not only successful but also deliver a greater return on investment. Partner with us to unlock the full potential of your development efforts.
4.1. Writing Testable Documentation
Creating testable documentation is essential for ensuring that the information provided is clear, accurate, and usable. Testable documentation allows developers and users to verify that the content meets its intended purpose. Here are some key aspects to consider:
- Clarity and Conciseness: Use simple language and avoid jargon. Each section should be easy to understand.
- Structured Format: Organize documentation into sections with headings and subheadings. This helps users find information quickly.
- Examples and Use Cases: Provide practical examples that illustrate how to use the software or feature. This aids in understanding and testing.
- Clear Instructions: Use step-by-step instructions for tasks. This allows users to follow along and verify outcomes.
- Version Control: Keep track of changes in documentation. This ensures that users are always referencing the most current information.
- Test Cases: Include specific test cases that users can run to validate the functionality described in the documentation. This is crucial for creating testable documentation.
4.2. Running Documentation Tests
Once the documentation is written, it is crucial to run tests to ensure its effectiveness. This process involves verifying that the documentation aligns with the actual functionality of the software. Here are steps to follow:
- Identify Test Scenarios: Determine which parts of the documentation need testing based on user needs and software features.
- Create Test Scripts: Develop scripts that outline the steps users should take to test the documentation.
- Execute Tests: Have users or testers follow the documentation to perform tasks. They should note any discrepancies or issues encountered.
- Collect Feedback: Gather feedback from testers regarding clarity, completeness, and usability of the documentation.
- Revise Documentation: Based on the feedback, make necessary adjustments to improve the documentation.
- Re-test: After revisions, run the tests again to ensure that the changes have resolved any issues.
5. Test Organization and Attributes
Organizing tests and understanding their attributes is vital for maintaining effective documentation. Here are some considerations:
- Categorization: Group tests based on functionality, user roles, or features. This makes it easier to manage and execute tests.
- Prioritization: Identify which tests are critical and should be run first. This helps in focusing on the most important aspects of the documentation.
- Traceability: Ensure that each test case is linked to specific documentation sections. This allows for easy tracking of changes and updates.
- Automation: Where possible, automate the testing process to save time and reduce human error. Tools like Selenium or Postman can be useful.
- Reporting: Create a reporting system to document test results. This helps in tracking progress and identifying areas for improvement.
- Continuous Improvement: Regularly review and update tests to reflect changes in the software or user needs. This ensures that documentation remains relevant and useful.
By following these guidelines, organizations can create and maintain high-quality documentation that is both testable and effective.
At Rapid Innovation, we understand the importance of clear and effective documentation in achieving your business goals. Our expertise in AI and Blockchain development ensures that we provide tailored solutions that enhance your operational efficiency. By partnering with us, you can expect improved clarity in your documentation processes, leading to greater user satisfaction and a higher return on investment. Our commitment to continuous improvement means that we will work with you to refine your documentation and testing processes, ensuring they evolve alongside your business needs. Let us help you achieve your goals efficiently and effectively.
5.1. Using #[should_panic] Attribute
The #[should_panic] attribute in Rust is used to indicate that a test is expected to fail due to a panic. This is particularly useful for testing error handling and ensuring that your code behaves as expected in failure scenarios.
- The test will pass if it panics and fail if it does not.
- It helps in validating that your code correctly triggers panic conditions.
- You can also specify a message to check against the panic message.
Example code:
language="language-rust"#[cfg(test)]-a1b2c3-mod tests {-a1b2c3- #[test]-a1b2c3- #[should_panic(expected = "assertion failed")]-a1b2c3- fn test_panic() {-a1b2c3- assert!(false, "assertion failed");-a1b2c3- }-a1b2c3-}
In this example, the test will pass because it panics with the expected message. If the assertion were true, the test would fail.
5.2. Ignoring Tests with #[ignore]
The #[ignore] attribute allows you to skip certain tests during the test run. This can be useful for tests that are not ready to be executed or are time-consuming.
- Ignored tests can be run selectively using the
--ignoredflag. - It helps in managing tests that are under development or require specific conditions to run.
Example code:
language="language-rust"#[cfg(test)]-a1b2c3-mod tests {-a1b2c3- #[test]-a1b2c3- #[ignore]-a1b2c3- fn test_not_ready() {-a1b2c3- // This test is ignored and won't run by default-a1b2c3- assert_eq!(1 + 1, 3);-a1b2c3- }-a1b2c3-}
To run ignored tests, you can use the following command:
language="language-bash"cargo test --ignored
This command will execute all tests, including those marked with #[ignore].
5.3. Conditional Compilation of Tests
Conditional compilation allows you to include or exclude tests based on certain conditions, such as the target operating system or feature flags. This is useful for writing platform-specific tests or tests that depend on certain features being enabled.
- Use
#[cfg(test)]to compile test code only when running tests. - Combine with other
#[cfg(...)]attributes to control when tests are included.
Example code:
language="language-rust"#[cfg(test)]-a1b2c3-mod tests {-a1b2c3- #[test]-a1b2c3- #[cfg(target_os = "windows")]-a1b2c3- fn test_windows_specific() {-a1b2c3- // This test only runs on Windows-a1b2c3- assert_eq!(1 + 1, 2);-a1b2c3- }-a1b2c3--a1b2c3- #[test]-a1b2c3- #[cfg(target_os = "linux")]-a1b2c3- fn test_linux_specific() {-a1b2c3- // This test only runs on Linux-a1b2c3- assert_eq!(1 + 1, 2);-a1b2c3- }-a1b2c3-}
In this example, the tests will only compile and run on their respective operating systems. This allows for more flexible and maintainable test suites that can adapt to different environments.
6. Advanced Testing Techniques
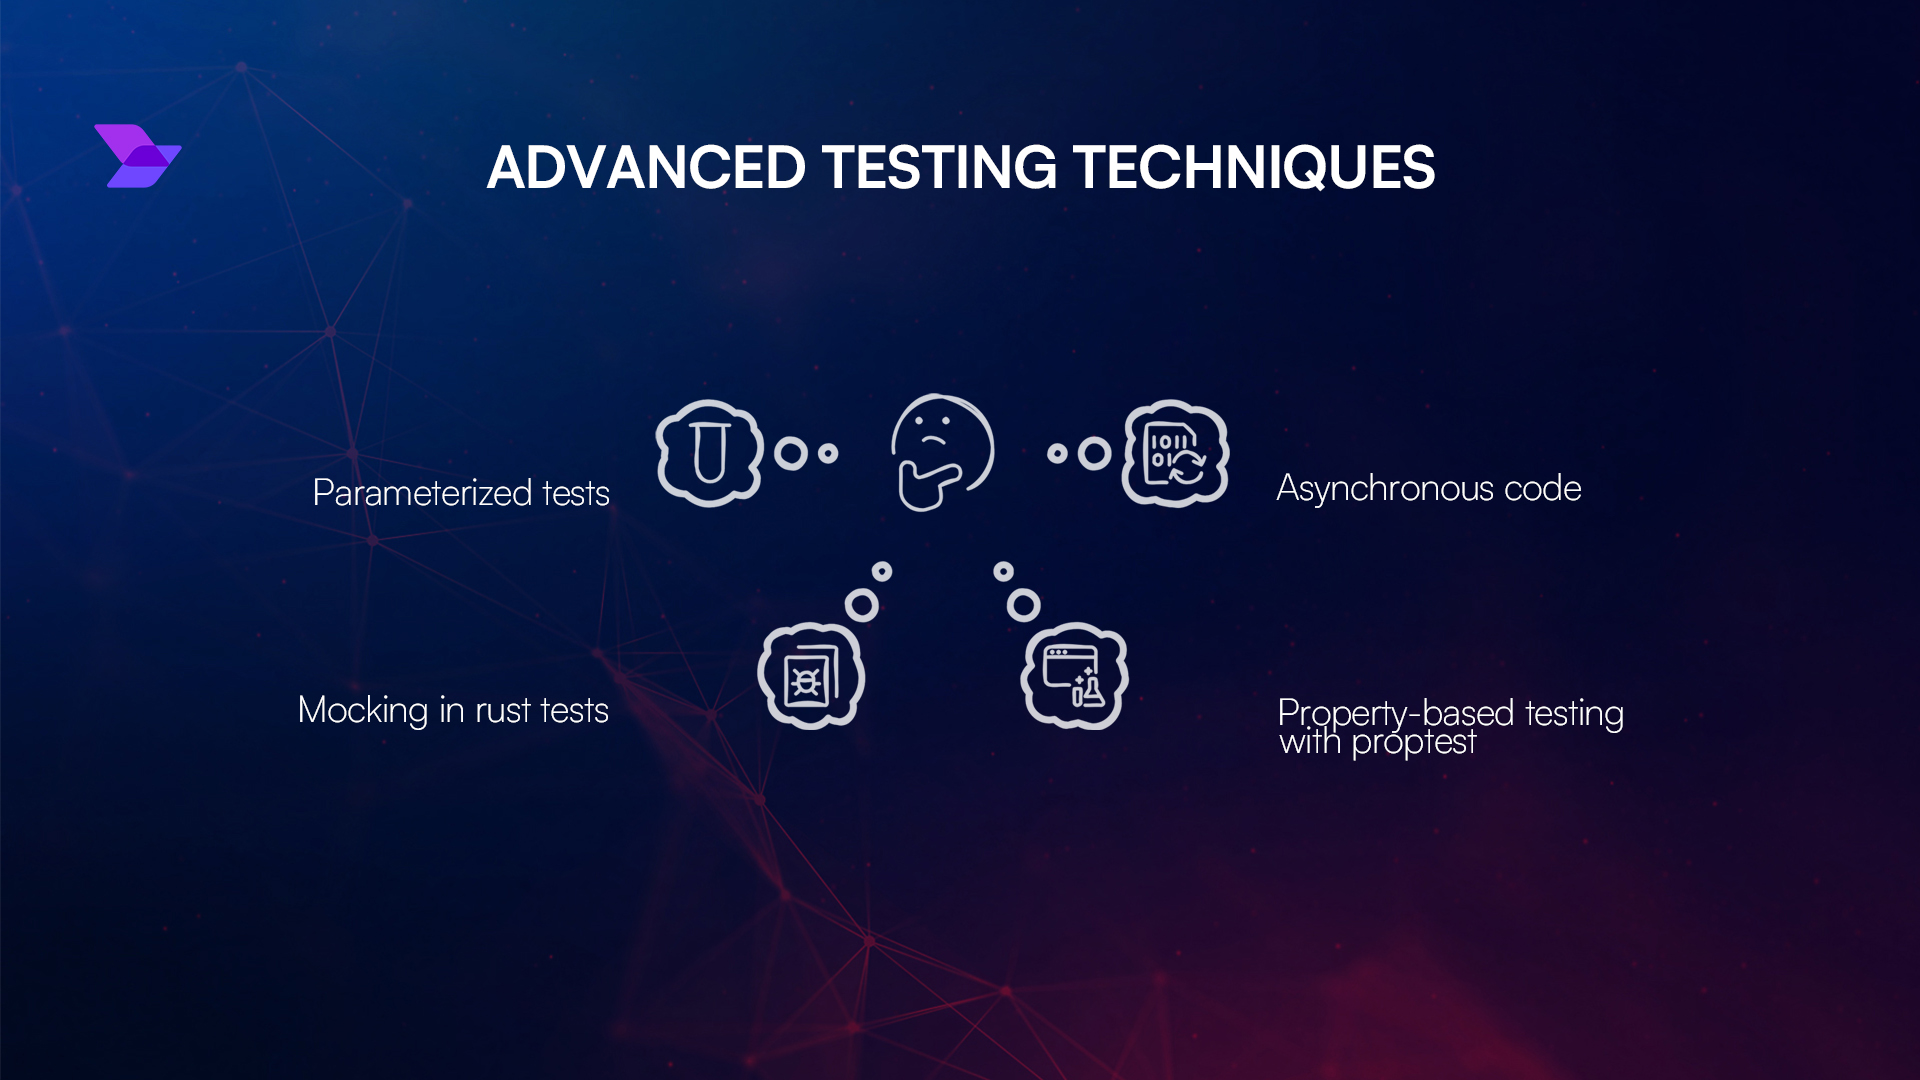
6.1. Parameterized Tests
Parameterized tests allow developers to run the same test with different inputs, making it easier to validate the behavior of a function or method under various conditions. This technique enhances test coverage and reduces code duplication, which is a key aspect of advanced testing techniques.
Benefits of Parameterized Tests:
- Increased Coverage: Test multiple scenarios with minimal code.
- Reduced Duplication: Write a single test case that can handle various inputs.
- Improved Readability: Clearly see how different inputs affect the output.
To implement parameterized tests, follow these steps:
- Choose a testing framework that supports parameterized tests (e.g., JUnit, NUnit, pytest).
- Define the test method and specify the parameters.
- Create a data source for the parameters (e.g., arrays, lists, or external files).
- Run the test with each set of parameters.
Example in Python using pytest:
language="language-python"import pytest-a1b2c3--a1b2c3-@pytest.mark.parametrize("input,expected", [-a1b2c3- (1, 2),-a1b2c3- (2, 3),-a1b2c3- (3, 4)-a1b2c3-])-a1b2c3-def test_increment(input, expected):-a1b2c3- assert increment(input) == expected
In this example, the test_increment function will run three times with different inputs, checking if the increment function behaves as expected.
6.2. Testing Asynchronous Code
Testing asynchronous code can be challenging due to the non-blocking nature of asynchronous operations. However, it is crucial to ensure that your asynchronous functions behave correctly and handle errors appropriately, which is an essential part of advanced software testing techniques.
Key Considerations for Testing Asynchronous Code:
- Use Appropriate Tools: Choose testing frameworks that support async testing (e.g., pytest with asyncio, Mocha for JavaScript).
- Handle Promises: Ensure that promises are resolved or rejected as expected.
- Test Timeouts: Verify that asynchronous operations complete within expected timeframes.
Steps to Test Asynchronous Code:
- Identify the asynchronous functions to be tested.
- Use async/await syntax to handle asynchronous calls in your tests.
- Mock external dependencies to isolate the function being tested.
- Validate the results and any side effects.
Example in JavaScript using Mocha and Chai:
language="language-javascript"const { expect } = require('chai');-a1b2c3-const { fetchData } = require('./dataService');-a1b2c3--a1b2c3-describe('fetchData', () => {-a1b2c3- it('should return data when called', async () => {-a1b2c3- const data = await fetchData();-a1b2c3- expect(data).to.be.an('object');-a1b2c3- expect(data).to.have.property('id');-a1b2c3- });-a1b2c3--a1b2c3- it('should throw an error on failure', async () => {-a1b2c3- try {-a1b2c3- await fetchData('invalid-url');-a1b2c3- } catch (error) {-a1b2c3- expect(error).to.be.an('error');-a1b2c3- }-a1b2c3- });-a1b2c3-});
In this example, the fetchData function is tested for both successful and erroneous outcomes, ensuring that it behaves correctly in different scenarios.
By employing advanced testing techniques like parameterized tests and testing asynchronous code, developers can create more robust and maintainable applications. At Rapid Innovation, we leverage advanced scripting techniques for test execution tools to enhance the quality of our clients' software solutions, ultimately driving greater ROI and ensuring that your projects are delivered efficiently and effectively. Partnering with us means you can expect improved software reliability, reduced time-to-market, and a significant boost in your overall project success, utilizing advanced software testing techniques to achieve these goals.
6.3. Mocking in Rust Tests
Mocking is a crucial technique in testing that allows developers to simulate the behavior of complex components. At Rapid Innovation, we understand the importance of robust testing methodologies, and we leverage techniques like mocking in rust to ensure that our clients' applications are reliable and efficient. In Rust, mocking can be achieved using various libraries, with mockito and mockall being the most popular.
- Why Mocking?
- Isolate the unit of code being tested.
- Simulate external dependencies like databases or APIs.
- Control the behavior of dependencies to test different scenarios.
- Using
mockitofor HTTP Requestsmockitois a library that allows you to mock HTTP requests.- It is particularly useful for testing code that interacts with web services.
- Steps to Use
mockito:- Add
mockitoto yourCargo.toml:
- Add
language="language-toml"[dev-dependencies]-a1b2c3- mockito = "0.31"
- Create a mock server in your test:
language="language-rust"#[cfg(test)]-a1b2c3- mod tests {-a1b2c3- use super::*;-a1b2c3- use mockito::{mock, Matcher};-a1b2c3--a1b2c3- #[test]-a1b2c3- fn test_api_call() {-a1b2c3- let _m = mock("GET", "/api/data")-a1b2c3- .with_status(200)-a1b2c3- .with_body(r#"{"key": "value"}"#)-a1b2c3- .create();-a1b2c3--a1b2c3- // Call your function that makes the HTTP request-a1b2c3- let response = your_function_that_calls_api();-a1b2c3- assert_eq!(response, expected_value);-a1b2c3- }-a1b2c3- }
- Using
mockallfor General Mockingmockallis a powerful mocking library that allows you to create mocks for traits.
- Steps to Use
mockall:- Add
mockallto yourCargo.toml:
- Add
language="language-toml"[dev-dependencies]-a1b2c3- mockall = "0.11"
- Define a trait and create a mock:
language="language-rust"#[cfg(test)]-a1b2c3- mod tests {-a1b2c3- use super::*;-a1b2c3- use mockall::{mock, predicate::*};-a1b2c3--a1b2c3- mock! {-a1b2c3- pub MyTrait {}-a1b2c3- impl MyTrait for MyStruct {-a1b2c3- fn my_method(&self) -> i32;-a1b2c3- }-a1b2c3- }-a1b2c3--a1b2c3- #[test]-a1b2c3- fn test_my_method() {-a1b2c3- let mut mock = MockMyTrait::new();-a1b2c3- mock.expect_my_method()-a1b2c3- .returning(|| 42);-a1b2c3--a1b2c3- assert_eq!(mock.my_method(), 42);-a1b2c3- }-a1b2c3- }
6.4. Property-Based Testing with PropTest
Property-based testing is a testing methodology where properties of the code are defined, and the testing framework generates random inputs to verify these properties. At Rapid Innovation, we utilize property-based testing to enhance the reliability of our clients' applications. In Rust, the proptest library is commonly used for this purpose.
- Why Use Property-Based Testing?
- Discover edge cases that may not be covered by traditional tests.
- Ensure that certain properties hold true for a wide range of inputs.
- Steps to Use
proptest:- Add
proptestto yourCargo.toml:
- Add
language="language-toml"[dev-dependencies]-a1b2c3- proptest = "1.0"
- Define properties and write tests:
language="language-rust"#[cfg(test)]-a1b2c3- mod tests {-a1b2c3- use super::*;-a1b2c3- use proptest::prelude::*;-a1b2c3--a1b2c3- proptest! {-a1b2c3- #[test]-a1b2c3- fn test_addition_commutative(a: i32, b: i32) {-a1b2c3- prop_assert_eq!(a + b, b + a);-a1b2c3- }-a1b2c3- }-a1b2c3- }
- Common Properties to Test:
- Associativity:
(a + b) + c == a + (b + c) - Identity:
a + 0 == a - Inverses:
a + (-a) == 0
- Associativity:
7. Debugging Rust Code
Debugging is an essential part of the development process, and Rust provides several tools to help identify and fix issues in your code. At Rapid Innovation, we emphasize the importance of effective debugging to ensure that our clients' applications perform optimally.
- Using the Rust Compiler:
- The Rust compiler provides helpful error messages that can guide you in fixing issues.
- Use
cargo checkto quickly identify compilation errors without building the entire project.
- Using Debugging Tools:
gdbandlldbcan be used to debug Rust applications.- You can compile your code with debug symbols by using the
--debugflag.
- Steps to Debug with
gdb:- Compile your code with debug information:
language="language-bash"cargo build --debug
- Start
gdbwith your binary:
language="language-bash"gdb target/debug/your_binary
- Set breakpoints and run your program:
language="language-gdb"(gdb) break main-a1b2c3- (gdb) run
- Using Logging:
- The
logcrate can be used to add logging to your application, which can help trace issues. - Use different log levels (info, warn, error) to categorize messages.
- The
By employing these techniques, Rapid Innovation ensures that we deliver high-quality, reliable applications for our clients. Our expertise in testing and debugging not only enhances the performance of your software but also contributes to a greater return on investment (ROI) by minimizing costly errors and downtime. Partnering with us means you can expect efficient solutions tailored to your specific needs, ultimately helping you achieve your business goals effectively.
7.1. Using println! and eprintln! for Debugging
In Rust, debugging can be effectively accomplished using the println! and eprintln! macros. These macros allow developers to output messages to the console, which can be invaluable for tracking down issues in code, utilizing various rust debugging techniques.
- println!: This macro is used to print messages to the standard output (stdout). It is useful for displaying variable values, program flow, and other information during execution.
Example:
language="language-rust"let x = 5;-a1b2c3-println!("The value of x is: {}", x);
- eprintln!: This macro prints messages to the standard error (stderr). It is particularly useful for logging errors or warnings, as it separates error messages from regular output. This can help in identifying issues without mixing them with standard output.
Example:
language="language-rust"let error_message = "An error occurred!";-a1b2c3-eprintln!("Error: {}", error_message);
- Best Practices:
- Use
println!for general information andeprintln!for error messages. - Include context in your messages to make debugging easier.
- Remove or comment out debugging statements in production code to avoid cluttering the output.
- Use
7.2. Rust's Built-in Debugger (LLDB/GDB)
Rust supports debugging through external debuggers like LLDB and GDB. These tools allow developers to inspect the state of a program while it is running, set breakpoints, and step through code line by line.
- LLDB: The LLVM debugger, which is often used on macOS and Linux systems.
- GDB: The GNU debugger, widely used on Linux systems.
- Key Features:
- Set breakpoints to pause execution at specific lines.
- Inspect variable values and memory.
- Step through code to follow the execution flow.
- Evaluate expressions in the current context.
7.2.1. Setting Up the Debugger
Setting up a debugger for Rust can vary based on the operating system and the chosen debugger. Here are the general steps to set up LLDB or GDB for Rust debugging:
- Install Rust: Ensure you have Rust installed on your system. You can install it using
rustup. - Install LLDB or GDB:
- For LLDB:
- On macOS, it comes pre-installed with Xcode.
- On Linux, you can install it using your package manager (e.g.,
sudo apt install lldbfor Ubuntu).
- For GDB:
- Install it using your package manager (e.g.,
sudo apt install gdbfor Ubuntu).
- Install it using your package manager (e.g.,
- For LLDB:
- Compile with Debug Information:
- Use the
--debugflag when compiling your Rust program to include debug information.
- Use the
language="language-bash"cargo build --debug
- Run the Debugger:
- For LLDB:
language="language-bash"lldb target/debug/your_program
- For GDB:
language="language-bash"gdb target/debug/your_program
- Basic Debugging Commands:
- Set a breakpoint:
language="language-bash"break main
- Run the program:
language="language-bash"run
- Step through the code:
language="language-bash"step
- Print variable values:
language="language-bash"print variable_name
By following these steps, you can effectively set up and utilize a debugger for your Rust applications, enhancing your ability to identify and fix issues in your code through various rust debugging techniques.
At Rapid Innovation, we understand the importance of efficient debugging in software development. Our team of experts is equipped to assist you in implementing best practices in debugging, ensuring that your projects are delivered on time and with the highest quality. By partnering with us, you can expect greater ROI through reduced development time and improved software reliability. Let us help you streamline your development process and achieve your goals effectively.
7.2.2. Basic Debugging Commands
Debugging is an essential part of software development, allowing developers to identify and fix issues in their code efficiently. Basic debugging commands vary depending on the programming language and the development environment, but some common commands include:
- Run: Executes the program from the beginning or a specified point. For example, you can use the command gdb to start debugging a program.
- Step Over: Executes the next line of code but does not enter any functions called on that line.
- Step Into: Executes the next line of code and enters any functions called on that line, allowing for deeper inspection.
- Step Out: Completes the execution of the current function and returns to the calling function.
- Continue: Resumes execution until the next breakpoint is encountered. You can use gdb list breakpoints to view all breakpoints set in your program.
- Quit: Exits the debugging session.
These commands help developers navigate through their code, making it easier to identify where things are going wrong and ensuring a smoother development process. For instance, using the python debug command line can provide a straightforward way to debug Python scripts.
7.2.3. Setting Breakpoints
Breakpoints are markers that you can set in your code to pause execution at a specific line. This allows you to inspect the state of the program at that moment. Setting breakpoints is a crucial part of the debugging process.
To set breakpoints, follow these steps:
- Open your code in the integrated development environment (IDE).
- Navigate to the line of code where you want to set a breakpoint.
- Click in the margin next to the line number or use a keyboard shortcut (e.g., F9 in Visual Studio).
- A visual indicator (often a red dot) will appear, showing that a breakpoint has been set.
Once breakpoints are set, you can run your program in debug mode. The execution will pause at each breakpoint, allowing you to:
- Inspect variable values.
- Evaluate expressions.
- Step through the code line by line.
For example, if you are using a bash debugger, you can set breakpoints in your shell scripts. Breakpoints can be removed by clicking on them again or using the IDE's breakpoint management features, providing flexibility in your debugging process.
7.2.4. Inspecting Variables
Inspecting variables is a critical part of debugging, as it allows you to see the current state of your program's data. This can help you understand how variables change over time and identify any discrepancies.
To inspect variables, you can use the following methods:
- Watch Window: Add variables to a watch list in your IDE. This allows you to monitor their values as you step through the code.
- Hovering: In many IDEs, you can hover over a variable during a debugging session to see its current value.
- Immediate Window: Use the immediate window to evaluate expressions or check the value of variables at any point during debugging. For Python, the python pdb command can be used to inspect variables directly from the command line.
By inspecting variables, you can:
- Confirm that variables hold the expected values.
- Identify any unexpected changes in variable states.
- Understand the flow of data through your program.
These debugging techniques are essential for effective software development, helping to ensure that your code runs as intended and ultimately leading to greater efficiency and return on investment for your projects. Additionally, using tools like valgrind command can help in identifying memory-related issues during debugging.
7.3. Using the log Crate for Structured Logging
Structured logging is a method of logging that allows you to capture log data in a structured format, making it easier to analyze and query. The log crate in Rust provides a flexible and efficient way to implement structured logging in your applications, including features for rust structured logging.
- Benefits of using the
logcrate:- Provides a unified logging interface for different logging implementations.
- Supports various log levels (error, warn, info, debug, trace).
- Allows for easy integration with other logging libraries like
env_loggerorlog4rs.
To use the log crate for structured logging, follow these steps:
- Add the
logcrate to yourCargo.tomlfile:
language="language-toml"[dependencies]-a1b2c3-log = "0.4"
- Implement logging in your Rust application:
language="language-rust"#[macro_use]-a1b2c3-extern crate log;-a1b2c3--a1b2c3-fn main() {-a1b2c3- // Initialize the logger-a1b2c3- env_logger::init();-a1b2c3--a1b2c3- // Log messages with structured data-a1b2c3- info!("User logged in", user_id = 42);-a1b2c3- error!("Failed to process request", request_id = 123);-a1b2c3-}
- Use a logging backend to capture and format the logs:
- For example, you can use
env_loggerfor simple console logging orlog4rsfor more advanced logging features.
- For example, you can use
By using the log crate, you can create logs that are not only human-readable but also machine-readable, making it easier to analyze logs with tools like ELK stack or Grafana. This approach is particularly beneficial for structured logging in rust.
7.4. Debugging with VS Code
Visual Studio Code (VS Code) is a powerful code editor that provides excellent support for debugging Rust applications. With its built-in debugging features, you can easily set breakpoints, inspect variables, and step through your code.
- Key features of debugging in VS Code:
- Integrated terminal for running commands.
- Breakpoints for pausing execution at specific lines.
- Variable inspection to view the current state of your application.
- Call stack navigation to trace function calls.
To start debugging a Rust application in VS Code, follow these steps:
- Install the Rust extension for VS Code:
- Search for "Rust" in the Extensions Marketplace and install the recommended extension.
- Open your Rust project in VS Code.
- Set breakpoints in your code by clicking in the gutter next to the line numbers.
- Start the debugger:
- Open the Run and Debug view by clicking on the play icon in the sidebar or pressing
Ctrl + Shift + D. - Click on "Run and Debug" to start the debugging session.
- Open the Run and Debug view by clicking on the play icon in the sidebar or pressing
7.4.1. Configuring launch.json
To customize your debugging experience in VS Code, you may need to configure the launch.json file. This file allows you to specify how the debugger should run your application.
- Steps to configure
launch.json:- Open the Run and Debug view in VS Code.
- Click on "create a launch.json file" link.
- Select "Rust" from the list of environments.
- Modify the generated
launch.jsonfile as needed:
language="language-json"{-a1b2c3- "version": "0.2.0",-a1b2c3- "configurations": [-a1b2c3- {-a1b2c3- "type": "rust",-a1b2c3- "request": "launch",-a1b2c3- "name": "Debug Rust",-a1b2c3- "program": "${workspaceFolder}/target/debug/your_project_name",-a1b2c3- "args": [],-a1b2c3- "cwd": "${workspaceFolder}",-a1b2c3- "stopAtEntry": false,-a1b2c3- "env": {},-a1b2c3- "preLaunchTask": "cargo build"-a1b2c3- }-a1b2c3- ]-a1b2c3-}
- Save the
launch.jsonfile.
With this configuration, you can easily run and debug your Rust application directly from VS Code, making the development process more efficient and streamlined.
At Rapid Innovation, we understand the importance of efficient development processes. By leveraging structured logging and powerful debugging tools like VS Code, we help our clients achieve greater ROI through enhanced application performance and reliability. Partnering with us means you can expect tailored solutions that streamline your development workflow, reduce time-to-market, and ultimately drive your business success.
7.4.2. Using Breakpoints and Watch Window
Breakpoints and the watch window are essential tools in debugging, allowing developers to pause execution and inspect the state of an application at specific points. This is particularly useful for identifying issues in complex code.
- Setting Breakpoints:
- Open your IDE (e.g., Visual Studio Code, IntelliJ).
- Navigate to the line of code where you want to pause execution.
- Click in the gutter next to the line number or use a keyboard shortcut (e.g., F9 in Visual Studio).
- Running the Debugger:
- Start the debugging session by clicking the debug icon or using the appropriate command (e.g., F5).
- The program will run until it hits a breakpoint.
- Using the Watch Window:
- Open the watch window from the debug menu.
- Add variables or expressions you want to monitor by typing them into the watch window.
- As you step through the code, the watch window will update with the current values.
- Stepping Through Code:
- Use "Step Over" (F10) to execute the current line and move to the next.
- Use "Step Into" (F11) to dive into function calls.
- Use "Step Out" (Shift + F11) to exit the current function.
- Inspecting Variables:
- Hover over variables in the code to see their current values.
- Use the locals window to view all local variables in the current scope.
These tools help in understanding the flow of the program and identifying where things go wrong.
8. Rust-Specific Debugging Techniques
Rust has unique features that can complicate debugging, particularly around ownership and borrowing. Here are some techniques tailored for Rust developers:
- Using
println!for Debugging: - Insert
println!statements to output variable values and program flow. - This is a simple yet effective way to trace execution without a debugger.
- Utilizing the Rust Compiler:
- The Rust compiler provides helpful error messages that can guide debugging.
- Pay attention to warnings and errors, as they often indicate ownership or borrowing issues.
- Using
cargo expand: - This command shows the expanded code after macros are applied, helping to understand complex macro behavior.
- Run
cargo expandin your terminal to see the output. - Debugging with
rust-gdborrust-lldb: - These are GDB and LLDB frontends tailored for Rust.
- They provide better integration with Rust's features, making it easier to debug.
- Using
cargo test: - Write tests to validate your code and catch issues early.
- Use
cargo test -- --nocaptureto see output fromprintln!during tests.
8.1. Debugging Ownership and Borrowing Issues
Ownership and borrowing are core concepts in Rust that can lead to complex debugging scenarios. Here are strategies to address these issues:
- Understanding Ownership Rules:
- Familiarize yourself with Rust's ownership rules: each value has a single owner, and ownership can be transferred.
- Use the Rust Book as a reference for ownership concepts.
- Using the Borrow Checker:
- The borrow checker enforces rules at compile time, preventing data races and ensuring memory safety.
- Pay attention to compiler messages; they often indicate where borrowing issues occur.
- Refactoring Code:
- If you encounter borrowing issues, consider refactoring your code to simplify ownership.
- Use references (
&T) and mutable references (&mut T) judiciously to avoid conflicts. - Utilizing
RcandArc: - For shared ownership, consider using
Rc<T>for single-threaded scenarios orArc<T>for multi-threaded contexts. - These types allow multiple owners of the same data, which can help resolve borrowing issues.
- Debugging with
cargo clippy: - Run
cargo clippyto catch common mistakes and improve code quality. - Clippy provides lints that can help identify potential ownership and borrowing problems.
By employing these techniques, Rust developers can effectively debug their applications and resolve ownership and borrowing issues.
At Rapid Innovation, we understand the complexities of debugging and the importance of efficient development processes. Our expertise in AI and Blockchain development ensures that we can help you navigate these challenges effectively. By partnering with us, you can expect enhanced productivity, reduced time-to-market, and ultimately, a greater return on investment. Our tailored solutions are designed to meet your specific needs, allowing you to focus on your core business objectives while we handle the technical intricacies. Let us help you achieve your goals efficiently and effectively.
8.2. Using std::mem::drop for Explicit Deallocation
In Rust, memory management is primarily handled through ownership and borrowing, which automatically deallocates memory when it goes out of scope. However, there are scenarios where you may want to explicitly deallocate memory before the variable goes out of scope. This is where std::mem::drop comes into play.
std::mem::dropis a function that takes ownership of a value and deallocates it immediately.- This can be useful in situations where you want to free up resources early, especially in long-running functions or loops.
- Using
dropcan help manage memory more efficiently and avoid holding onto resources longer than necessary.
Example usage:
language="language-rust"fn main() {-a1b2c3- let x = String::from("Hello, world!");-a1b2c3- println!("{}", x);-a1b2c3--a1b2c3- // Explicitly drop x-a1b2c3- std::mem::drop(x);-a1b2c3--a1b2c3- // x is no longer valid here-a1b2c3- // println!("{}", x); // This would cause a compile-time error-a1b2c3-}
8.3. Debugging Lifetime Issues
Lifetime issues in Rust can lead to compile-time errors or unexpected behavior at runtime. Understanding and debugging these issues is crucial for writing safe and efficient Rust code.
- Lifetimes are annotations that tell the Rust compiler how long references should be valid.
- Common lifetime issues include dangling references, where a reference points to data that has been deallocated.
- The Rust compiler uses a borrow checker to enforce these rules, but sometimes you may encounter errors that require deeper investigation.
To debug lifetime issues:
- Use the Rust compiler's error messages as a guide. They often provide hints about which references are causing problems.
- Consider using lifetime annotations in function signatures to clarify how long references should live.
- Break down complex functions into smaller ones to isolate the lifetime issues.
Example of a lifetime issue:
language="language-rust"fn main() {-a1b2c3- let r; // r is declared but not initialized-a1b2c3--a1b2c3- {-a1b2c3- let x = 42;-a1b2c3- r = &x; // r borrows x, but x goes out of scope-a1b2c3- }-a1b2c3--a1b2c3- // println!("{}", r); // This would cause a compile-time error-a1b2c3-}
8.4. Investigating Memory Leaks with Valgrind
Valgrind is a powerful tool for detecting memory leaks and memory management issues in programs. While Rust's ownership model helps prevent many common memory leaks, it is still possible to encounter them, especially when interfacing with C libraries or using unsafe code.
- Valgrind can help identify memory that has been allocated but not freed, which can lead to increased memory usage over time.
- It provides detailed reports on memory usage, including the location of leaks and the stack traces leading to them.
To use Valgrind:
- Install Valgrind on your system (available on most Linux distributions).
- Compile your Rust program with debug information enabled:
language="language-bash"cargo build --debug
- Run your program with Valgrind:
language="language-bash"valgrind --leak-check=full target/debug/your_program
- Analyze the output for any memory leaks or issues reported by Valgrind.
By following these steps, you can effectively manage memory in Rust, debug lifetime issues, and investigate potential memory leaks using Valgrind. This is particularly important in the context of rust memory management, as it ensures that your applications run efficiently and safely.
9. Performance Profiling
Performance profiling is a crucial step in optimizing applications, allowing developers to identify bottlenecks and improve efficiency. At Rapid Innovation, we leverage advanced tools for performance profiling in Rust, such as Flamegraph and Criterion, as well as other profiling tools like python profiling code, sql profiler, and intel vtune, to help our clients achieve their development goals effectively.
9.1. Using the flame Crate for Flamegraphs
Flamegraphs are a visualization tool that helps developers understand where time is being spent in their applications. The flame crate in Rust simplifies the process of generating flamegraphs, enabling our clients to visualize performance data effortlessly.
Steps to use the flame crate for flamegraphs:
- Add the flame crate to your
Cargo.toml:
language="language-toml"[dependencies]-a1b2c3-flame = "0.4"
- Import the flame crate in your Rust code:
language="language-rust"#[macro_use]-a1b2c3-extern crate flame;
- Wrap the code you want to profile with the
flame::startandflame::endmacros:
language="language-rust"fn main() {-a1b2c3- flame::start("main");-a1b2c3- // Your code here-a1b2c3- flame::end("main");-a1b2c3-}
- Run your application with the
RUSTFLAGSenvironment variable set to enable profiling:
language="language-bash"RUSTFLAGS="-C instrument-coverage" cargo run
- Generate the flamegraph data:
language="language-bash"cargo flamegraph
- View the generated flamegraph in your browser. This will provide a visual representation of function call times, helping you identify performance bottlenecks.
Flamegraphs can significantly aid in understanding complex performance issues. They allow you to see which functions consume the most time, making it easier to focus your optimization efforts. By utilizing this tool, our clients can enhance their application's performance, leading to greater efficiency and improved user satisfaction.
9.2. Benchmarking with Criterion
Criterion is a powerful benchmarking library for Rust that provides statistical analysis of performance measurements. It helps ensure that your code changes do not negatively impact performance, which is essential for maintaining high-quality applications.
Steps to benchmark with Criterion:
- Add Criterion to your
Cargo.toml:
language="language-toml"[dev-dependencies]-a1b2c3-criterion = "0.3"
- Import Criterion in your test module:
language="language-rust"use criterion::{criterion_group, criterion_main, Criterion};
- Create a benchmarking function:
language="language-rust"fn my_function() {-a1b2c3- // Code to benchmark-a1b2c3-}
- Set up the Criterion benchmark:
language="language-rust"fn criterion_benchmark(c: &mut Criterion) {-a1b2c3- c.bench_function("my_function", |b| b.iter(|| my_function()));-a1b2c3-}
- Define the main function to run the benchmarks:
language="language-rust"criterion_group!(benches, criterion_benchmark);-a1b2c3-criterion_main!(benches);
- Run the benchmarks:
language="language-bash"cargo bench
Criterion will provide detailed reports on the performance of your functions, including mean execution time, standard deviation, and more. This statistical approach helps you make informed decisions about code changes and optimizations.
Using Criterion can help you track performance regressions over time, ensuring that your application remains efficient as it evolves. By partnering with Rapid Innovation, clients can expect to leverage these powerful tools, including performance profiler, visual studio profiler, and nvidia profiler, to enhance their development processes, ultimately leading to a higher return on investment (ROI) through improved application performance and user experience.
By utilizing both Flamegraphs and Criterion, developers can gain deep insights into their application's performance, leading to more efficient and optimized code. At Rapid Innovation, we are committed to helping our clients achieve their goals efficiently and effectively through our expertise in AI and Blockchain development, as well as utilizing tools like jetbrains dottrace, cpu profiling, and performance analysis visual studio.
9.3. Identifying Performance Bottlenecks
Identifying performance bottlenecks is crucial for optimizing software applications. Bottlenecks can occur at various levels, including code, database, network, and hardware. Here are some strategies to identify them:
- Profiling Tools: Utilize profiling tools to analyze the performance of your application. Tools like
gprof,perf, orValgrindcan help identify which functions consume the most resources, allowing for targeted optimizations. Additionally, consider using website speed optimization tools to assess the performance of your web applications. - Logging and Monitoring: Implement comprehensive logging to track the execution time of different parts of your application. Monitoring tools like Prometheus or Grafana can provide valuable insights into performance metrics over time, enabling proactive management of potential issues. For WordPress sites, using plugins to speed up WordPress site can enhance monitoring capabilities.
- Load Testing: Conduct thorough load testing using tools like Apache JMeter or Gatling to simulate user traffic and identify how your application behaves under stress. This helps in understanding the limits of your application and planning for scalability. For web applications, improving page speed through load testing can significantly enhance user experience.
- Database Query Analysis: Leverage database profiling tools to analyze slow queries. Tools like
EXPLAINin SQL can help you understand how queries are executed and where optimizations can be made, ultimately improving data retrieval times. This is particularly important for optimizing web performance in database-driven applications. - Code Review: Regular code reviews can help identify inefficient algorithms or data structures that may lead to performance issues. This collaborative approach fosters a culture of quality and continuous improvement. In the context of WordPress, reviewing the use of best WordPress speed optimization plugins can lead to better performance.
- Benchmarking: Create benchmarks for critical parts of your application to measure performance changes over time. This can help you identify regressions after code changes, ensuring that performance remains a priority throughout the development lifecycle. For instance, benchmarking page speed optimization can provide insights into the effectiveness of your optimization efforts.
10. Continuous Integration and Testing
Continuous Integration (CI) is a development practice that encourages developers to integrate code into a shared repository frequently. This practice helps in detecting errors quickly and improving software quality. Key components of CI include:
- Automated Builds: Set up automated builds to ensure that the code compiles correctly every time a change is made, reducing the risk of integration issues.
- Automated Testing: Implement automated tests to verify that new changes do not break existing functionality. This includes unit tests, integration tests, and end-to-end tests, which collectively enhance the reliability of your software.
- Version Control: Use version control systems like Git to manage code changes and facilitate collaboration among team members, ensuring that everyone is aligned and working with the latest codebase.
- Feedback Loop: Establish a feedback loop where developers receive immediate notifications about the success or failure of their builds and tests. This rapid feedback mechanism accelerates the development process and enhances code quality.
- Deployment Automation: Automate the deployment process to ensure that the latest code is always available in production, minimizing downtime and improving user experience.
10.1. Setting Up CI for Rust Projects
Setting up Continuous Integration for Rust projects involves configuring a CI service to build and test your Rust code automatically. Here’s how to do it:
- Choose a CI Service: Select a CI service like GitHub Actions, Travis CI, or CircleCI that supports Rust, ensuring compatibility with your development workflow.
- Create a Configuration File: Create a configuration file (e.g.,
.github/workflows/rust.ymlfor GitHub Actions) to define the CI pipeline, streamlining the integration process. - Define Build Steps: Specify the steps to install Rust, build the project, and run tests. Here’s an example for GitHub Actions:
language="language-yaml"name: Rust CI-a1b2c3--a1b2c3-on: [push, pull_request]-a1b2c3--a1b2c3-jobs:-a1b2c3- build:-a1b2c3- runs-on: ubuntu-latest-a1b2c3--a1b2c3- steps:-a1b2c3- - name: Checkout code-a1b2c3- uses: actions/checkout@v2-a1b2c3--a1b2c3- - name: Set up Rust-a1b2c3- uses: actions-rs/toolchain@v1-a1b2c3- with:-a1b2c3- toolchain: stable-a1b2c3--a1b2c3- - name: Build-a1b2c3- run: cargo build --verbose-a1b2c3--a1b2c3- - name: Run tests-a1b2c3- run: cargo test --verbose
- Run the CI Pipeline: Push your changes to the repository. The CI service will automatically trigger the pipeline, running the defined steps and ensuring that your code is continuously validated.
- Monitor Results: Check the CI service dashboard for build and test results. Address any failures promptly to maintain code quality and ensure a smooth development process.
By following these steps, you can effectively set up CI for your Rust projects, ensuring that your code is always tested and ready for deployment. At Rapid Innovation, we are committed to helping you implement these best practices, enabling you to achieve greater ROI through enhanced software performance and reliability. Partnering with us means you can expect improved efficiency, reduced time-to-market, and a robust development process that aligns with your business goals, including optimizing site speed and utilizing effective performance optimization tools.
10.2. Automating Tests with GitHub Actions
At Rapid Innovation, we understand that maintaining a robust codebase is crucial for your business success. GitHub Actions is a powerful tool for automating workflows, including testing your code. By integrating tests into your CI/CD pipeline, you can ensure that your code is always in a deployable state, ultimately leading to greater efficiency and a higher return on investment (ROI).
- Setting Up GitHub Actions:
- Create a
.github/workflowsdirectory in your repository. - Add a YAML file (e.g.,
ci.yml) to define your workflow. - Specify the events that trigger the workflow, such as
pushorpull_request. - Example Workflow Configuration:
language="language-yaml"name: CI-a1b2c3--a1b2c3-on:-a1b2c3- push:-a1b2c3- branches:-a1b2c3- - main-a1b2c3- pull_request:-a1b2c3--a1b2c3-jobs:-a1b2c3- test:-a1b2c3- runs-on: ubuntu-latest-a1b2c3- steps:-a1b2c3- - name: Checkout code-a1b2c3- uses: actions/checkout@v2-a1b2c3--a1b2c3- - name: Set up Rust-a1b2c3- uses: actions-rs/toolchain@v1-a1b2c3- with:-a1b2c3- toolchain: stable-a1b2c3--a1b2c3- - name: Run tests-a1b2c3- run: cargo test
- Benefits of Using GitHub Actions:
- Integration: Seamlessly integrates with your GitHub repository, allowing for a smooth development process.
- Scalability: Supports multiple jobs and parallel execution, enabling your team to scale operations without compromising quality.
- Customization: Allows for custom scripts and actions, tailoring the workflow to meet your specific project needs.
10.3. Code Coverage with cargo-tarpaulin
Understanding the extent of your code coverage is essential for ensuring software quality. cargo-tarpaulin is a tool specifically designed for Rust projects to measure code coverage, helping you identify areas for improvement.
- Installing cargo-tarpaulin:
- Use Cargo to install the tool:
language="language-bash"cargo install cargo-tarpaulin
- Running Code Coverage:
- Execute the following command to generate a coverage report:
language="language-bash"cargo tarpaulin --out Xml
- This command will produce an XML report that can be used with CI tools or for further analysis.
- Interpreting Coverage Reports:
- Coverage reports show which lines of code were executed during tests.
- Aim for a high percentage of coverage, but remember that 100% coverage does not guarantee bug-free code.
- Benefits of Code Coverage:
- Identifies Uncovered Code: Helps pinpoint areas lacking tests, allowing for targeted improvements.
- Improves Code Quality: Encourages writing more tests, leading to better software and reduced long-term costs.
- Facilitates Refactoring: Provides confidence when modifying code, ensuring that changes do not introduce new issues.
11. Best Practices and Common Pitfalls
When automating tests and measuring code coverage, adhering to best practices can significantly enhance your workflow and drive better results for your organization.
- Best Practices:
- Keep Tests Fast: Ensure that tests run quickly to encourage frequent execution, minimizing downtime.
- Use Descriptive Names: Name your tests clearly to convey their purpose, improving team collaboration.
- Run Tests on Every Commit: Automate testing on every push to catch issues early, reducing the cost of fixing bugs.
- Review Coverage Reports Regularly: Analyze coverage reports to identify gaps in testing, ensuring comprehensive quality assurance.
- Common Pitfalls:
- Ignoring Coverage Metrics: Relying solely on coverage percentages can be misleading; focus on meaningful tests that add value.
- Overcomplicating Workflows: Keep your CI/CD pipelines simple to avoid confusion and maintenance issues, ensuring a smooth development process.
- Neglecting Documentation: Document your testing and coverage processes to help team members understand the workflow, fostering a culture of quality.
By following these guidelines, you can effectively automate your testing processes and ensure high code quality through comprehensive coverage analysis. Partnering with Rapid Innovation allows you to leverage our expertise in AI and Blockchain development, ensuring that your projects are executed efficiently and effectively, ultimately leading to greater ROI.
11.1. Writing Testable Code
At Rapid Innovation, we understand that writing testable code is essential for ensuring that your software is reliable and maintainable. Our expertise in AI and Blockchain development allows us to implement testable code best practices that enhance your project's success. Here are some key practices we advocate for:
- Modular Design: We break your code into small, independent modules, making it easier to test each component in isolation. This approach not only improves testability but also enhances collaboration among development teams.
- Use Dependency Injection: Instead of hardcoding dependencies, we utilize dependency injection to pass them into your classes. This allows for easier mocking and stubbing during tests, ultimately leading to a more flexible and maintainable codebase.
- Follow the Single Responsibility Principle: Our team ensures that each function or class has one responsibility, making it easier to understand and test. This principle is crucial for maintaining clarity and reducing complexity in your software.
- Write Clear Interfaces: We define clear and concise interfaces for your modules, facilitating the creation of mock implementations for testing. This clarity helps in streamlining the development process.
- Avoid Side Effects: We emphasize that functions should not have side effects that affect the state of the application. This predictability during tests leads to more reliable software.
- Use Meaningful Names: Our developers use clear and descriptive names for functions and variables, improving readability and making it easier to write tests. This practice enhances collaboration and reduces misunderstandings.
11.2. Avoiding Common Testing Mistakes
Testing is a critical part of the development process, and at Rapid Innovation, we help our clients avoid common pitfalls that can undermine effectiveness. Here are some mistakes we guide you to avoid:
- Not Writing Tests First: We encourage adopting Test-Driven Development (TDD) to ensure tests are written before coding. This proactive approach leads to higher quality code and fewer bugs.
- Overlooking Edge Cases: Our team focuses on testing not just the happy path but also edge cases. We ensure that your software is robust against unexpected inputs and scenarios.
- Ignoring Test Maintenance: We regularly review and update tests to ensure they remain relevant as your code evolves. This ongoing maintenance is crucial for long-term success.
- Writing Tests That Are Too Complex: We advocate for simple and focused tests. Complex tests can be difficult to understand and maintain, so we prioritize clarity in our testing strategies.
- Not Running Tests Frequently: We integrate testing into your continuous integration pipeline, ensuring that tests are run frequently. This early detection of issues saves time and resources.
- Neglecting Documentation: Our team emphasizes the importance of documenting tests to prevent confusion. Well-documented tests help others understand their purpose and facilitate smoother collaboration.
11.3. Balancing Test Coverage and Development Speed
While achieving high test coverage is important, it should not come at the expense of development speed. At Rapid Innovation, we implement strategies to find the right balance for your projects:
- Prioritize Critical Code: We focus on testing the most critical parts of your application first, ensuring that the most important features are reliable and perform as expected.
- Use Automated Testing: Our implementation of automated tests speeds up the testing process, allowing for quick feedback and reducing manual testing time. This efficiency translates to faster project delivery.
- Adopt a Risk-Based Approach: We identify areas of your code that are more prone to bugs and prioritize testing those areas. This targeted approach maximizes the impact of your testing efforts.
- Set Realistic Coverage Goals: We aim for a reasonable level of test coverage rather than striving for 100%. This pragmatic approach helps maintain development speed while ensuring quality.
- Incorporate Code Reviews: Our code review process catches potential issues early, reducing the need for extensive testing later on. This proactive measure enhances overall code quality.
- Iterate and Improve: We continuously assess your testing strategy and make adjustments as needed. This iterative process helps maintain a balance between coverage and speed.
By partnering with Rapid Innovation, you can create a robust testing strategy that enhances the quality of your software while maintaining development efficiency. Our commitment to excellence ensures that you achieve greater ROI and meet your business goals effectively through effective testable code practices.
12. Conclusion
12.1. Recap of Key Testing and Debugging Concepts
Testing and debugging are essential components of software development, particularly in Rust, which emphasizes safety and performance. Here’s a recap of the key concepts:
- Unit Testing:
- Focuses on testing individual components or functions in isolation.
- Rust provides built-in support for unit tests using the
#[cfg(test)]attribute.
- Integration Testing:
- Tests how different modules work together.
- Located in the
testsdirectory, these tests can access the public API of your crate.
- Documentation Tests:
- Ensures that examples in your documentation are correct.
- Use the
cargo testcommand to run these tests automatically.
- Debugging Techniques:
- Print Debugging: Involves adding print statements to track variable values and program flow.
- Using the Rust Debugger (gdb/lldb): Allows for step-by-step execution and inspection of variables.
- Logging: Utilize the
logcrate to log messages at various levels (info, warn, error) for better insight into application behavior.
- Error Handling:
- Rust’s
ResultandOptiontypes provide a robust way to handle errors without panicking. - Use pattern matching to handle different outcomes effectively.
- Rust’s
- Test Coverage:
- Measure how much of your code is tested using tools like
cargo tarpaulin. - Aim for high coverage to ensure reliability and maintainability.
- Measure how much of your code is tested using tools like
- Continuous Integration (CI):
- Automate testing using CI tools like GitHub Actions or Travis CI.
- Ensure that tests run on every commit to catch issues early.
12.2. Further Resources for Rust Testing and Debugging
For those looking to deepen their understanding of testing and debugging in Rust, several resources are available:
- The Rust Book:
- A comprehensive guide that includes sections on testing and debugging.
- Rust by Example:
- Offers practical examples, including testing and error handling.
- Rust Documentation:
- Official documentation provides in-depth information on testing frameworks and debugging tools.
- Community Forums:
- Engage with the Rust community on platforms like Reddit or the Rust Users Forum for tips and shared experiences.
- Books and Courses:
- Consider books like "Programming Rust" or online courses that focus on testing and debugging practices.
By leveraging these concepts and resources, developers can enhance their skills in rust testing and debugging, leading to more robust and reliable Rust applications.
At Rapid Innovation, we understand the importance of these practices in delivering high-quality software solutions. Our expertise in AI and Blockchain development ensures that we can guide you through the complexities of testing and debugging, ultimately helping you achieve greater ROI. Partnering with us means you can expect efficient project execution, reduced time-to-market, and a significant enhancement in the reliability of your applications. Let us help you turn your vision into reality with our tailored development and consulting solutions.